 by
by 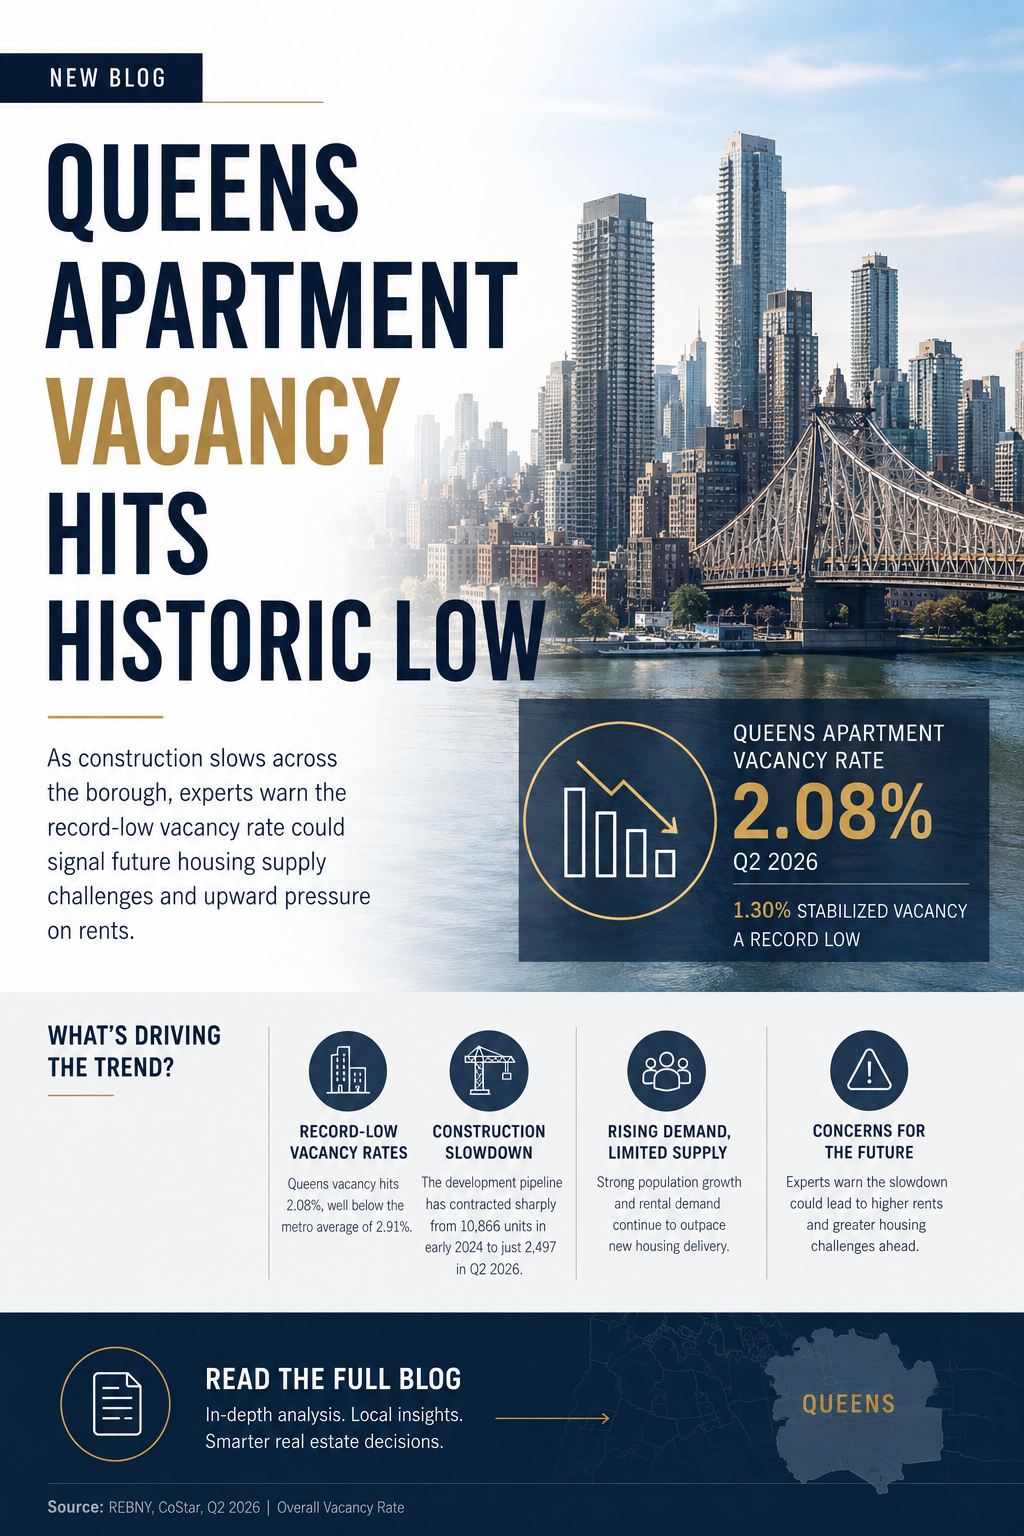
Queens Apartment Vacancy Hits Historic Low as Construction Slowdown Raises Concerns About Future Housing Supply
Queens apartment vacancy has fallen to a record low as multifamily construction slows sharply, raising concerns about future housing supply and rent growth.
Queens’ rental market is growing more competitive as apartment vacancies decline and the borough’s once-robust multifamily construction pipeline shrinks. With stabilized vacancy at a historic low, the widening gap between housing demand and future development could reshape rents, investment activity, and multifamily development across the borough.
Queens Rental Market Continues to Tighten
Queens is entering a potentially pivotal new phase of its housing cycle. Apartment demand remains strong, vacancies are falling, and fewer new multifamily developments are moving through the construction pipeline.
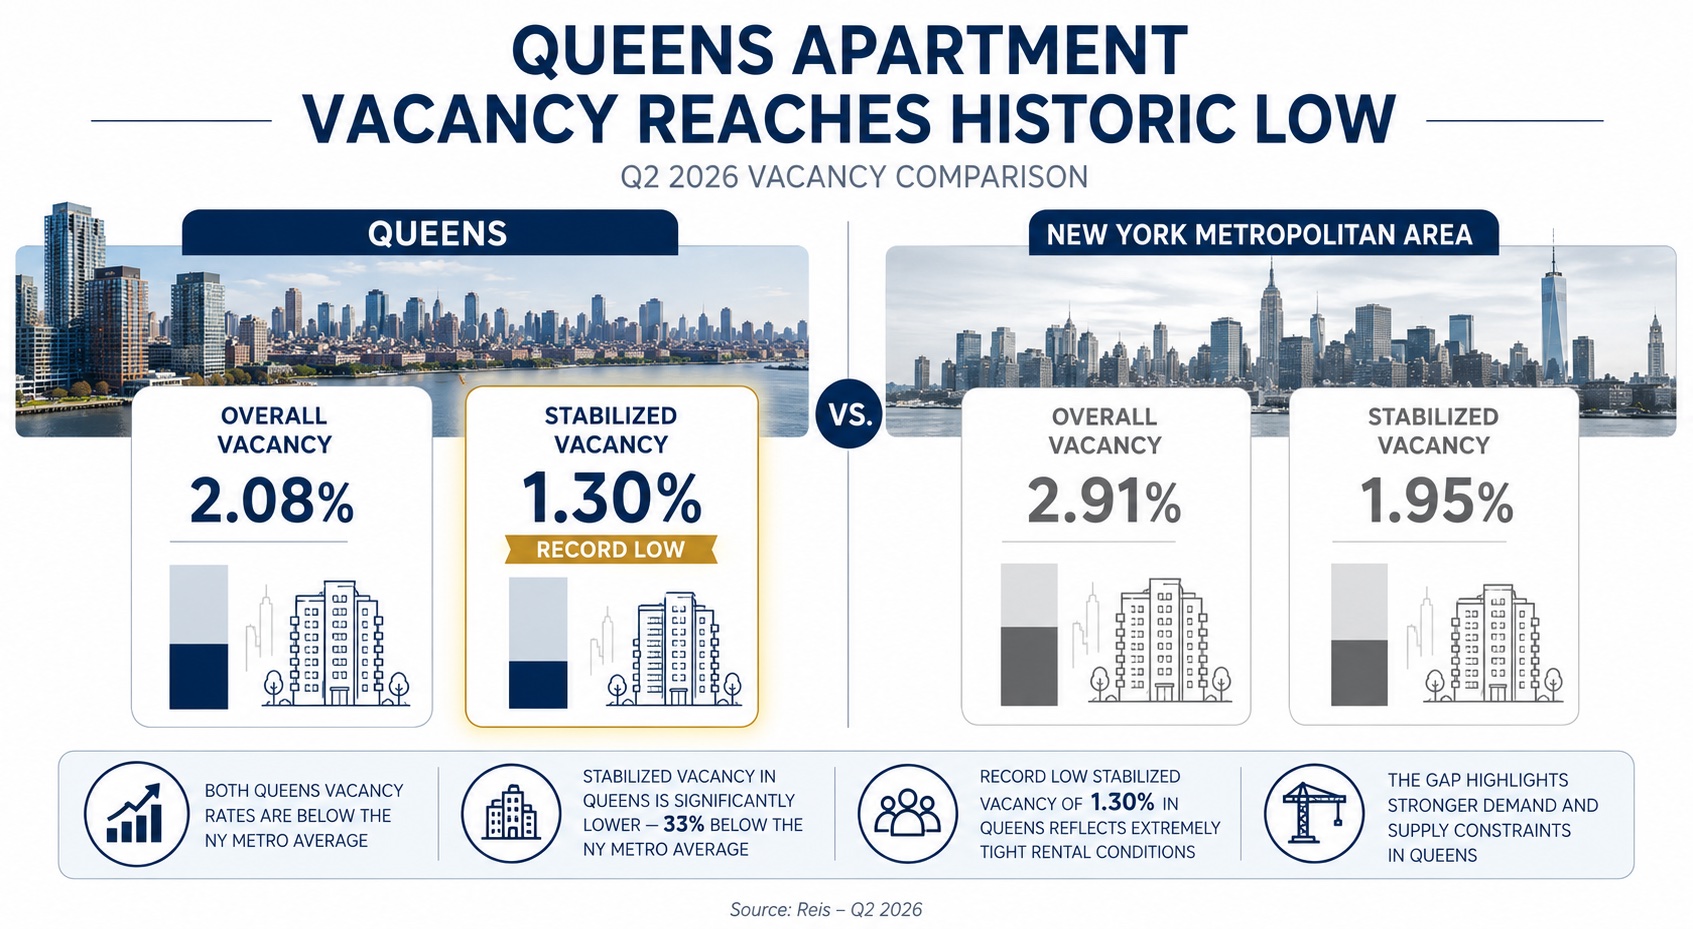
Overall apartment vacancy in Queens fell to approximately 2.08% in the second quarter of 2026, down from 2.93% a year earlier.
The trend looks even more significant once recently completed and lease-up properties are excluded from the calculation. Vacancy among stabilized apartment properties — generally buildings that are at least 90% occupied or have been operating for at least 18 months — dropped to approximately 1.30%, a record low.
For comparison, the broader New York metropolitan area posted approximately 2.91% overall vacancy and 1.95% stabilized vacancy.
These numbers suggest Queens isn’t simply experiencing temporary fluctuations tied to new deliveries. Existing rental properties are operating with extremely limited availability, pointing to strong underlying demand across the borough. Jump to Queens construction pipeline analysis
Why Stabilized Vacancy Matters More Than the Headline Number
Overall vacancy rates can paint a misleading picture of a market that’s actively developing. When a large residential tower opens, hundreds of apartments can hit the market simultaneously. Until those units are leased, they temporarily inflate the borough’s vacancy rate — but that doesn’t necessarily signal weakening demand.
Stabilized vacancy offers a clearer view because it largely excludes newly delivered properties still working through their initial lease-up periods.
Queens illustrates this difference well. Over the past several years, thousands of new apartments entered the market. Those deliveries occasionally pushed overall vacancy higher, yet stabilized vacancy kept trending downward — falling from approximately 1.44% in early 2024 to 1.30% by the second quarter of 2026. That movement suggests renters have continued absorbing available apartments throughout the borough even as developers delivered significant amounts of new housing.
Queens Is Running Out of Apartments Under Construction
The more consequential issue may be what happens next. Queens’ multifamily construction pipeline has contracted dramatically: apartment units under construction fell from approximately 10,866 in early 2024 to just 2,497 by the second quarter of 2026 — a decline of roughly 77% in a little over two years.
A slowdown of this magnitude doesn’t create an immediate shortage, since developments already underway continue reaching completion. But construction pipelines operate with significant lag. Projects being finished today may have been financed, approved, and started years earlier. When construction starts decline sharply, the effect typically shows up later — once existing projects wrap up and there isn’t enough behind them to take their place.
Queens could therefore face a stretch in which apartment deliveries slow just as existing rental inventory grows increasingly occupied. Jump to Long Island City analysis
Long Island City Is at the Center of the Construction Pullback
No Queens neighborhood illustrates this shift more clearly than Long Island City.
Over the past decade, Long Island City has become one of New York City’s most important residential development districts. Former industrial properties, warehouses, parking facilities, and underused parcels have been converted into high-density apartment communities. Its proximity to Manhattan, extensive subway connections, waterfront location, and relatively large development sites made the neighborhood especially attractive to institutional developers.
But the construction pipeline has changed significantly. Apartments under construction in Long Island City reportedly fell from approximately 5,620 units in early 2024 to just 679 in the second quarter of 2026 — an extraordinary contraction for a neighborhood that has historically generated a large share of Queens’ new apartment supply. As existing projects near completion, few large developments appear ready to take their place.
Recent Apartment Deliveries Temporarily Expanded Available Inventory
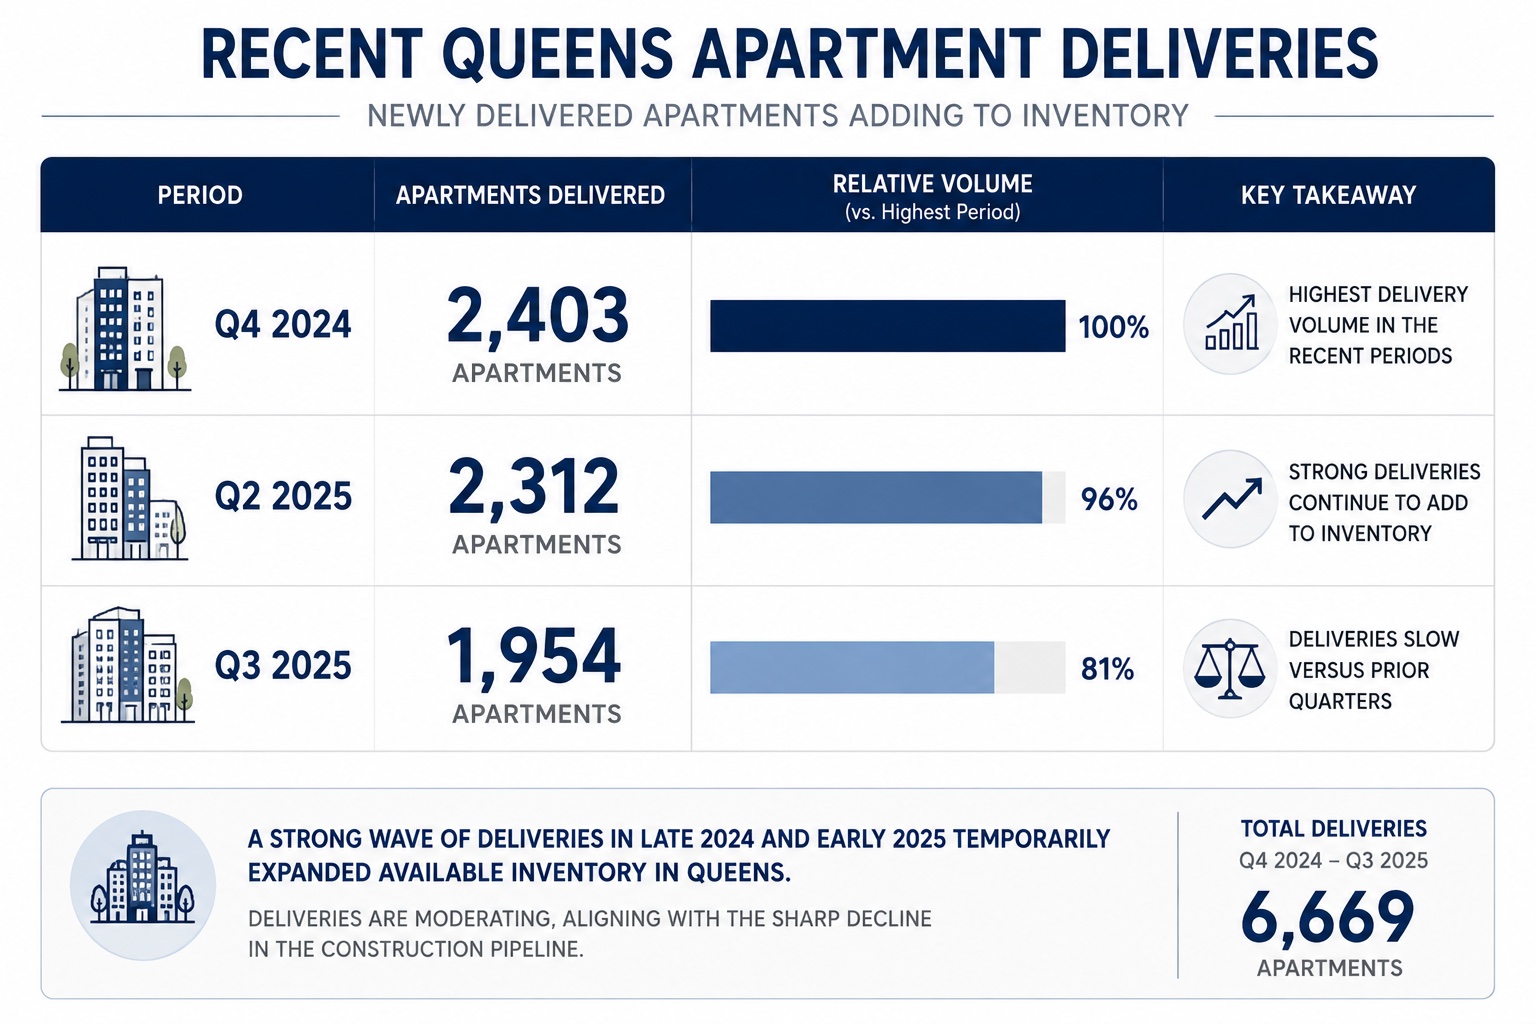
The current slowdown follows several stretches of unusually strong apartment deliveries. Queens added approximately:
- 2,403 apartments in the fourth quarter of 2024
- 2,312 apartments in the second quarter of 2025
- 1,954 apartments in the third quarter of 2025
These waves of new construction temporarily pushed up overall vacancy as developers began leasing newly completed buildings. Large developments often take months — sometimes considerably longer — to reach stabilized occupancy, and during that window, hundreds of available units can show up in vacancy statistics even when leasing activity remains healthy.
That’s why it matters so much that stabilized vacancy kept declining despite these deliveries. It indicates established apartment buildings weren’t seeing widespread increases in empty units; instead, much of the apparent vacancy was concentrated in newly built properties still moving through their initial lease-up cycles.
Strong Demand Is Absorbing Queens Apartment Inventory
Several structural factors continue to support apartment demand in Queens. The borough offers access to Manhattan’s employment centers along with a broader range of housing types and neighborhoods than much of Manhattan provides.
Long Island City and Astoria draw renters seeking proximity to Midtown. Sunnyside and Woodside pair transit access with established residential communities, while neighborhoods farther east offer additional alternatives for households priced out of Manhattan or western Brooklyn.
Transportation infrastructure remains a key draw. Multiple subway lines, the Long Island Rail Road, bus networks, bridges, highways, and ferry connections link different parts of Queens to major employment centers across New York City. With housing costs elevated citywide, this mix of accessibility and relative value can sustain rental demand even during periods of economic uncertainty. Jump to rent growth analysis
[177 lines collapsed]As Queens’ multifamily construction pipeline contracts and stabilized vacancy sits at a record low, the chart below maps how a shrinking supply of new apartments could eventually translate into stronger Queens rent growth — even as broader economic conditions and higher interest rates continue to shape development economics across the borough.
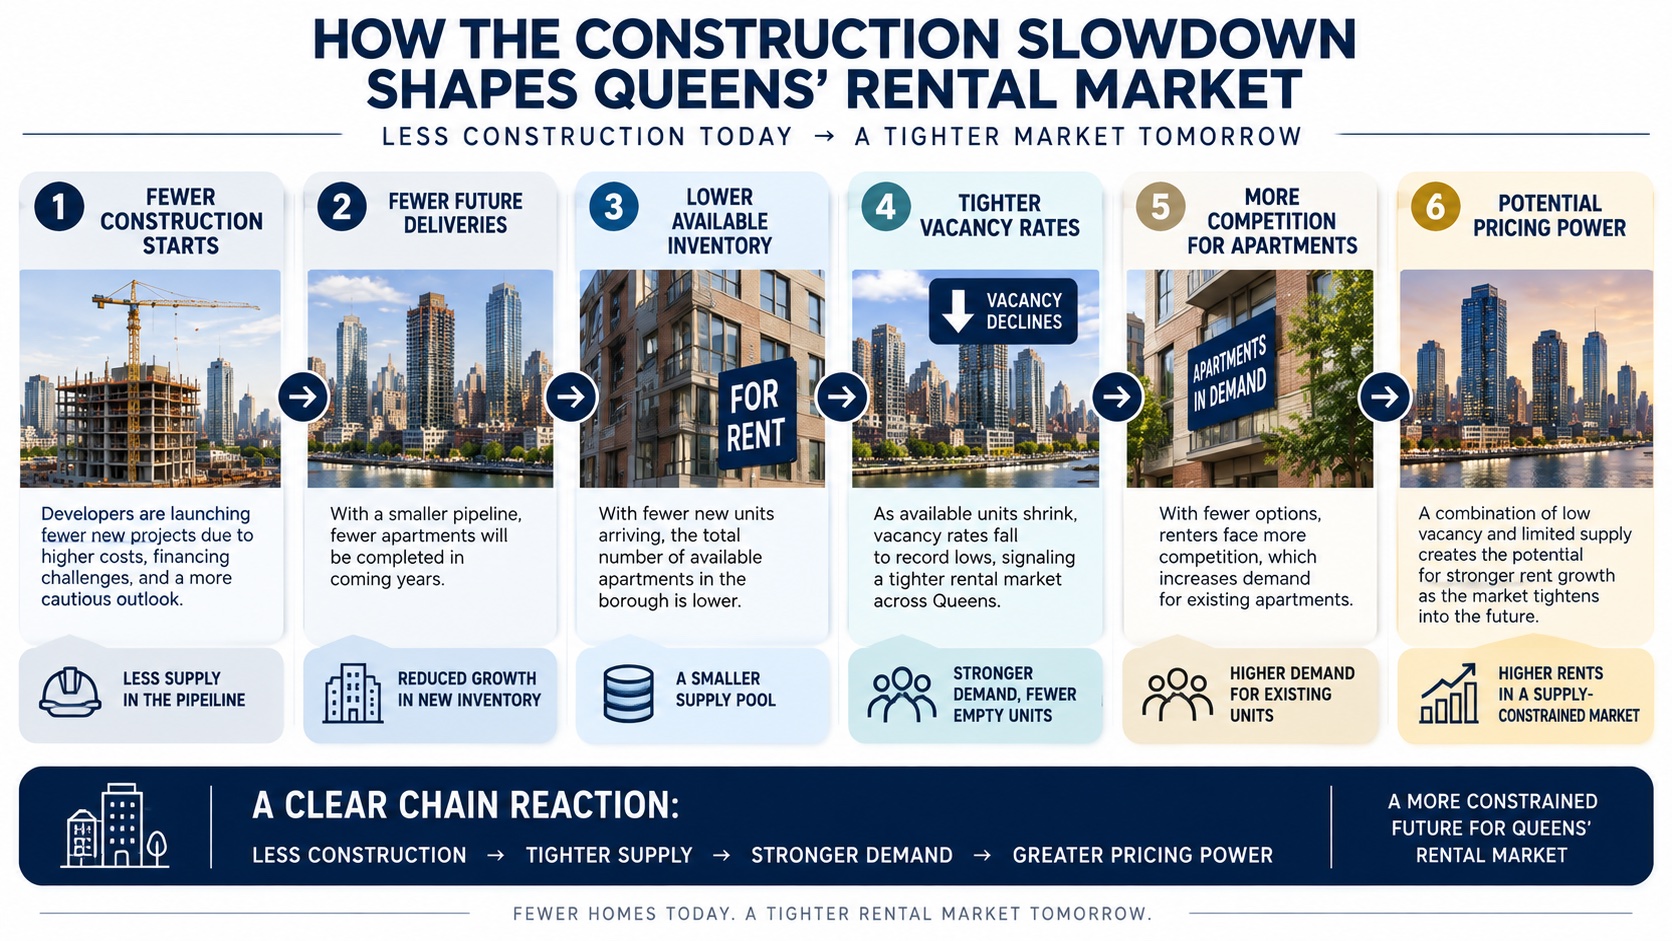
This infographic examines one of the most consequential second-order effects of Queens’ housing market tightening: the potential link between a dramatically smaller construction pipeline and future rent growth. With apartment units under construction falling roughly 77% from early 2024 levels and stabilized vacancy reaching a record-low 1.30%, the graphic likely visualizes how reduced deliveries intersect with sustained rental demand across neighborhoods from Astoria to Long Island City. The chart may compare historical construction volumes against occupancy trends, lease-up patterns, or projected inventory gaps to show why rental markets become more competitive when new supply slows while household formation and migration continue. Key callouts may reference the lag between construction starts and completions — meaning today’s pipeline contraction may not fully affect availability until existing projects finish — while emphasizing that extremely low vacancy narrows renter alternatives in the meantime. The visual also situates Queens within the broader New York metropolitan area, where overall and stabilized vacancy rates remain higher than the borough’s current levels. For investors tracking multifamily fundamentals, policymakers evaluating housing supply, and renters comparing neighborhoods, this chart clarifies why the construction slowdown matters most precisely when occupancy is already high. It connects directly to themes explored in Strong Demand Is Absorbing Queens Apartment Inventory and the borough-wide trends detailed in Queens Is Running Out of Apartments Under Construction, offering a data-driven framework for understanding when — and under what conditions — tighter supply could translate into stronger effective rents rather than merely tighter lease-up timelines on newly delivered buildings.
The rent growth chart above makes the supply-demand tension visible: Queens may still be absorbing recent apartment deliveries, but the pipeline behind the next cycle has contracted sharply. With stabilized vacancy already at historic lows and deliveries poised to slow, the infographic helps explain why landlords could eventually gain more pricing leverage — a dynamic also relevant to multifamily investment analysis across New York City.
A shrinking development pipeline matters most when vacancy is already low. Rental markets depend on a fairly steady flow of new apartments to accommodate household formation, migration, employment growth, and renters moving between neighborhoods. When construction falls while demand holds steady or rises, landlords may gain more pricing power.
[70 lines collapsed]No Queens neighborhood better illustrates the borough’s development shift than Long Island City — and the infographic below quantifies the scale of its construction pullback, from thousands of units under construction to just hundreds, while connecting that trend to multifamily investment dynamics and the broader Queens market outlook.
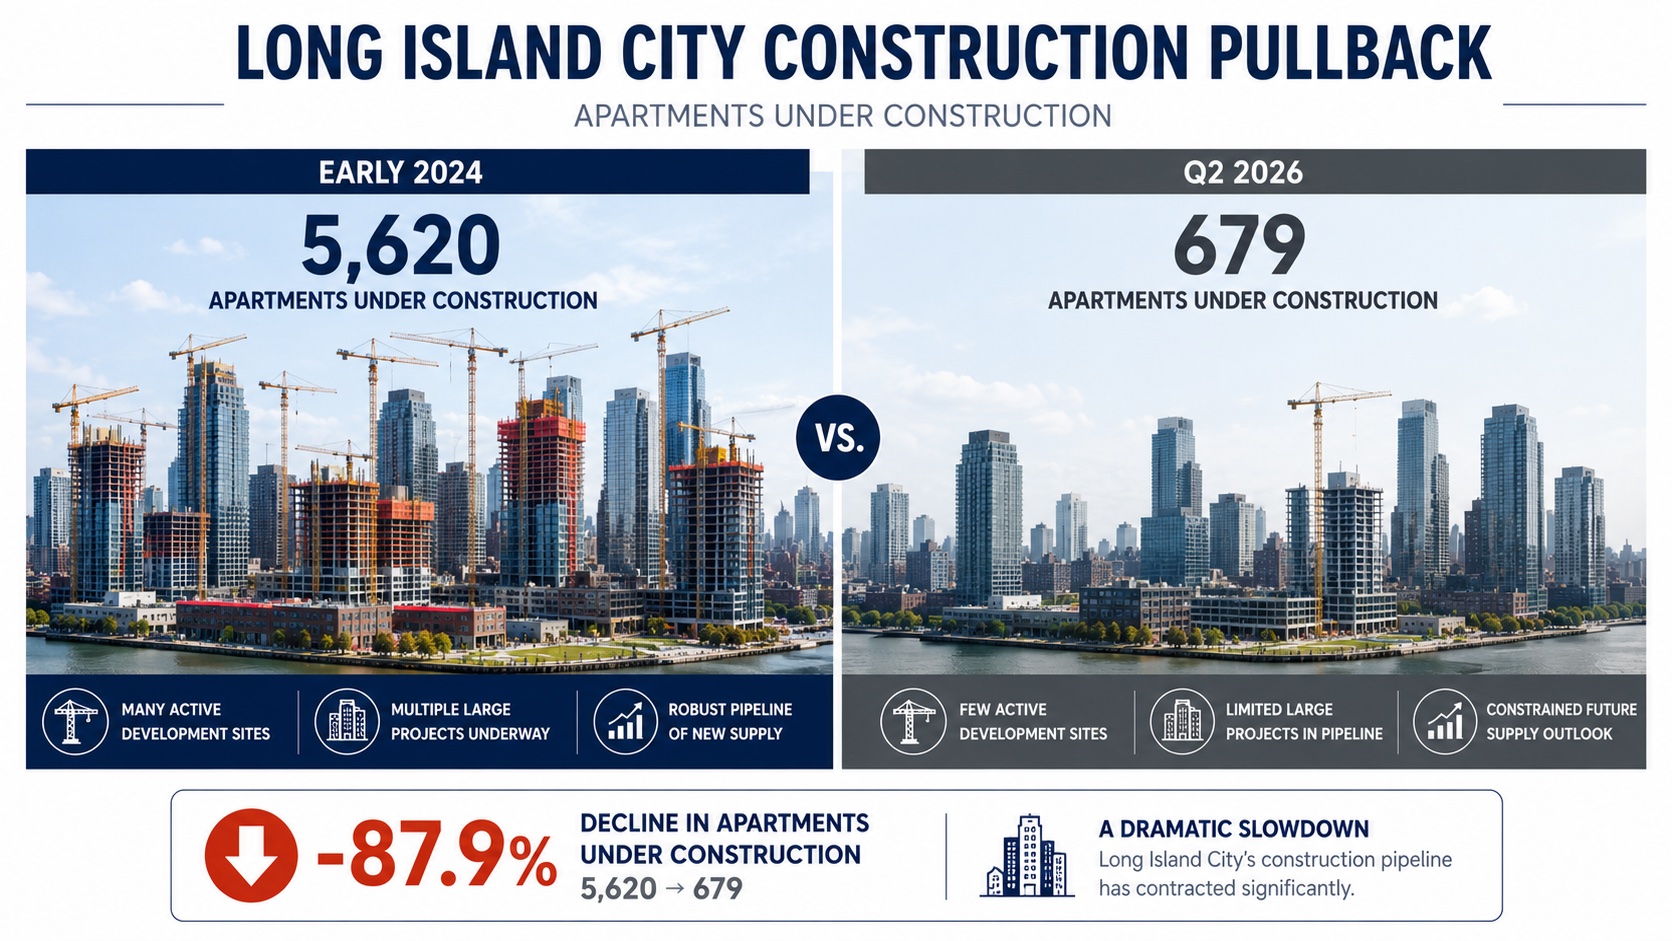
This infographic focuses on Long Island City, the neighborhood at the center of Queens’ apartment development story and the sharpest edge of the borough’s construction slowdown. Over the past decade, LIC transformed former industrial sites, warehouses, and underused parcels into one of New York City’s most important high-density residential districts, drawing institutional developers with Manhattan proximity, extensive subway access, waterfront locations, and large development sites. The graphic likely visualizes the extraordinary contraction in active construction: apartments under construction reportedly fell from approximately 5,620 units in early 2024 to just 679 in the second quarter of 2026 — an unprecedented pullback for a neighborhood that historically generated a large share of Queens’ new housing supply. Visual elements may include timelines of delivery waves, neighborhood-level pipeline comparisons, or maps highlighting LIC’s role relative to Astoria, Sunnyside, and other Queens submarkets. The chart underscores a critical market transition: as existing towers near completion, few large replacement projects appear ready, meaning renters who once relied on a steady stream of newly built apartments with modern amenities and leasing concessions may find fewer choices ahead. For owners of stabilized buildings, reduced competition from new supply could eventually support occupancy and effective rents, particularly near major subway stations — though outcomes still depend on financing conditions, regulatory incentives such as 485-x, and broader commercial real estate cycles. Investors evaluating defensive multifamily assets will watch LIC closely because its trajectory may preview borough-wide supply constraints before they fully appear in vacancy and rent statistics citywide.
The Long Island City infographic above distills why the neighborhood matters as a real-time test case for Queens’ housing cycle. With active development falling far faster than borough-wide averages, LIC may offer the earliest signals of how construction contraction, rent dynamics, and multifamily investment performance interact once the current wave of completions finishes and fewer large projects stand ready to replace them.
Long Island City will be especially worth watching. The neighborhood has undergone enormous physical transformation over the past two decades, creating thousands of apartments and establishing a high-density residential district directly across the East River from Manhattan. For years, renters could count on a steady pipeline of newly completed buildings offering modern amenities and leasing incentives.
[30 lines collapsed]Several forward-looking indicators will determine whether Queens’ development slowdown proves temporary or evolves into a lasting supply constraint — and the chart below visualizes the central trend: a shrinking multifamily construction pipeline moving in the opposite direction of record-low stabilized vacancy, with implications for 485-x, financing conditions, and the borough’s future housing supply.
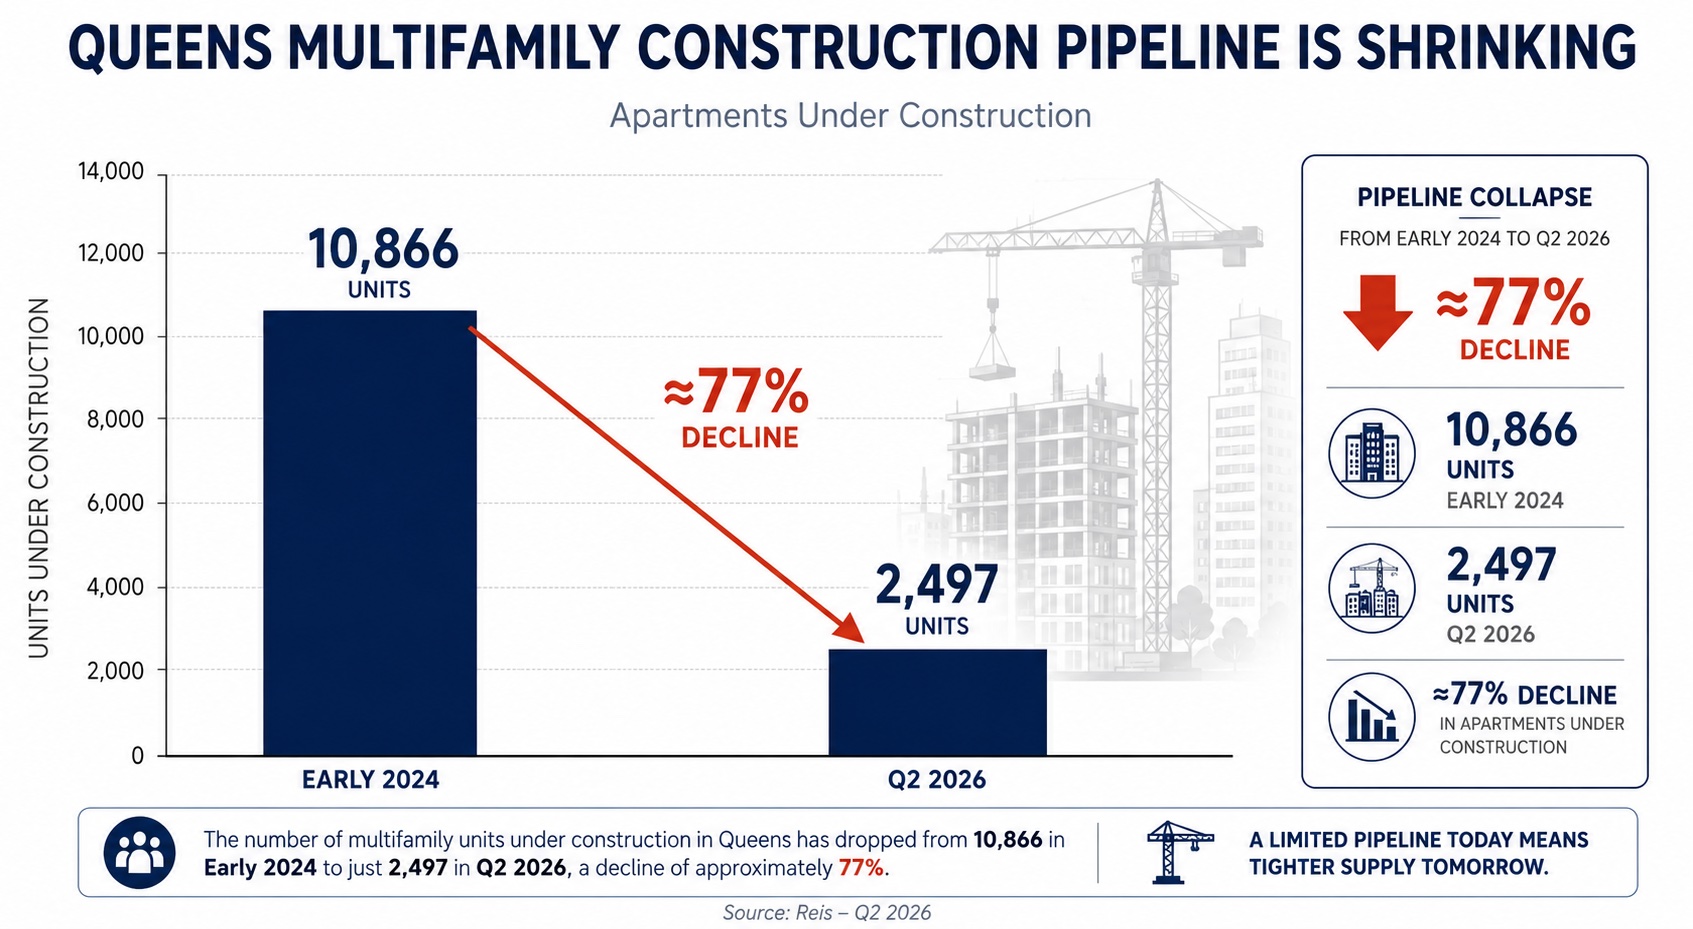
This chart provides a borough-wide view of the supply-side shift defining Queens’ current apartment market: the multifamily construction pipeline is shrinking rapidly even as rental demand remains robust. Apartment units under construction fell from approximately 10,866 in early 2024 to just 2,497 by the second quarter of 2026 — a decline of roughly 77% in a little over two years — while overall vacancy dropped to approximately 2.08% and stabilized vacancy reached a record-low 1.30%. The graphic likely tracks pipeline volumes over time, potentially breaking out major development corridors such as Long Island City alongside borough-level totals, and may contrast recent delivery waves — including strong completions in 2024 and 2025 — against the much smaller pool of projects now actively under construction. That distinction matters because completions may stay relatively healthy in the near term as previously financed developments finish, but once those projects wrap up, the size of the next cycle will determine how much inventory reaches the market in subsequent years. The visual connects directly to the indicators analysts, developers, and policymakers should monitor: construction starts, lender appetite for multifamily loans, the effectiveness of incentive programs, and whether stabilized vacancy stays near current record lows. For readers following multifamily investment trends or comparing Queens to Manhattan’s very different supply tools — including limited reliance on office-to-residential conversions — this chart frames the central question posed throughout the article: not how many apartments are vacant today, but how many will be available tomorrow once today’s pipeline clears and fewer projects stand behind it.
The Queens pipeline chart above anchors the market outlook section by making the supply gap tangible: completions may hold up temporarily, but the next construction cycle looks substantially smaller. Tracking this trend alongside financing conditions, 485-x uptake, and stabilized vacancy will be essential for anyone assessing whether Queens faces a pause in development or a longer-term housing supply constraint.
Several indicators will determine whether the current slowdown turns out to be a temporary pause or a longer-term supply constraint.